A New Model for Inclusive Computer Science Education
Our post today is a guest post by Carol L. Fletcher, Ph.D., Director, Expanding Computing Education Pathways (EPIC), The University of Texas Austin. This post originally appeared in Google’s The Keyword and is reprinted with permission.
In this post, Dr. Fletcher explains the CAPE framework that she and Dr. Jayce Warner (also at the University of Texas Austin) developed. Along with several of our collaborators, our project teams at CSEdResearch.org have used CAPE to help understand how a school’s Capacity for CS education impacts who takes CS and their experiences–all with an equity lens. It has been a critical model for us, and we believe it can be a useful model for other education researchers and evaluators. We are also recipients of a 2020 Google CS-ER Award, from which Fletcher and Warner’s work is also funded.
The lack of diversity in the computing education pipeline has been a remarkably persistent problem. Something that’s stalled progress in addressing disparities is that there’s largely been a focus on individuals, such as teachers and students, rather than on how equity plays out across multiple levels of the computer science (CS) education ecosystem. This is why our work at the University of Texas since 2014 focuses on understanding the root causes of inequities in the CS education pipeline and how every level of the system influences equity.
With the support of a CS-ER (computer science education research) grant from Google, my colleague Jayce Warner and I developed a framework for thinking about equity across the CS education ecosystem. We began this work after digging into data in Texas in 2014 and finding that only about a quarter of Texas high schools offered any kind of CS course and fewer than 3% of Texas students were taking a CS course each year. The students enrolled in CS courses were also not reflective of the student population in our diverse state. We launched what became the WeTeach_CS professional development program, with the ultimate objective of seeing equitable enrollment in CS courses in Texas. To achieve this goal, we first had to improve access to CS courses and increase the number of CS-certified teachers in the state.
At the time, we thought equity had to wait until we had solved the capacity, access and participation challenges. But as we began thinking more deeply about this model and asking our colleagues in the Expanding Computing Education Pathways (ECEP) Alliance for feedback, we realized several things:
True Equity is about more than just diversity in the classroom, and just because something is available to everyone doesn’t mean that everyone can or will benefit. Also, education is very complex and the things we can easily measure (such as AP class participation) may not be the best indicators of change or success.
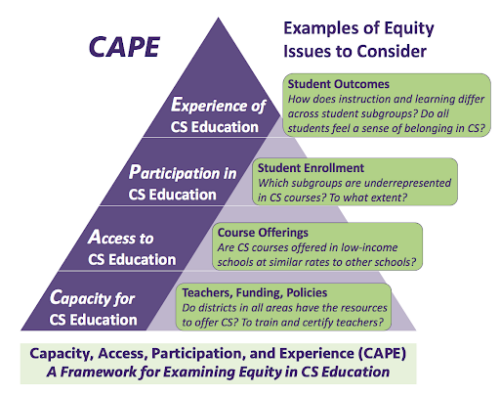
We developed a new framework that reflects how things connect at different levels of CS education. Most importantly, this model helps us better understand how equity plays out at each level. We’ve called it the CAPE framework and it consists of four interdependent components: capacity for CS education, access to CS education, participation in CS education and experience of CS education.
Each level affects the next. For example, if we want students to have equitable experiences in CS, we first need to make sure they’re participating equitably. Equitable participation relies on equitable access and equitable access relies on equitable capacity.

CAPE is represented as a triangle with four levels. Capacity for CS Education is the foundational level of the triangle, with access to CS education above that, participation in CS education above that, and experiences of CS education at the top. Example questions that can be asked at the Capacity level address teachers, funding and policies such as Do districts in all areas have the resources to offer CS and to train and certify teachers? Access questions deal with course offerings such as Are CS courses offered in low-income schools at similar rates to other schools? Questions at the participation level address student enrollment such as Which subgroups are underrepresented in CS courses and to what extent? Experience level questions can address student outcomes such as How does instruction and learning differ across student subgroups and do all students feel a sense of belonging in CS?
The CAPE Framework helps the entire CS education community think about the systems they work in and the types of questions they should ask to ensure equity and inclusion in computing. One example is Jackie Corricelli, a PreK-12 CS Curriculum Specialist in West Hartford Public Schools (CT), who’s used the CAPE framework to evaluate her district’s K-12 CS program. In another example, Bryan Cox, Computer Science Specialist at the Georgia Department of Education, is building a public dashboard to track access and participation in K-12 CS education in Georgia. In Texas, we’ve used CAPE to frame our state and regional CSEd Profiles and recently released a new interactive visualization to explore capacity, access and participation across the state’s 1,200 school districts and more than 2,000 high schools.
Google supported these efforts with a CS-ER grant awarded to UT Austin, which was instrumental in the development and evolution of the CAPE framework. In 2021, Google awarded seven new CS-ER grants. This year’s grant awardees are: Amy J. Ko, University of Washington; Derek Aguiar, University of Connecticut; Jean Ryoo, University of California, Los Angeles; Jennifer Parham-Mocello, Oregon State University; Joshua Childs and Tia Madkins, The University of Texas at Austin; Melanie Williamson and Audrey Brock, Bluegrass Community & Technical College; and Mounia Ziat, Bentley University.
For more information about each of the recipient’s projects, or to submit an application to be considered for future cohorts, you can visit Google Research’s Outreach page.


 Bishakha Upadhyaya is a Senior at